Atelier Bonryu(E)
infrared photography


Atelier Bonryu(E)
infrared photography


When we take an infrared photograph or an ultraviolet photograph we become curious if the taken photograph is really an image brought by infrared or ultraviolet lights, and at which wavelength range the filter and the lens transmit the lights and the sensor detects them. So let’s measure the range of wavelength of a photographed light under the sunlight.
Conditions required for this measurement are, at first, light with wide wavelength range can be prepared and, secondly, the wavelength of the light which forms the image can be measured. The first condition is considered to be met by the use of light reflected off the white surface under the sunlight on a sunny day. Second condition is satisfied by measuring the position of the spectrum from a spectroscope which is taken by a set of a filter, a lens and a camera of interest. Therefore, we decided to make a simple spectroscope by using a grating sheet. In the following we describe how to make and use the simple spectroscope.
The most important part of a spectroscope is the part to decompose the lights with respect to their wavelength, where we use a grating sheet made by a hologram. Of course, we can also draw a spectrum by taking advantage of the fact that the refractive index of glass is different depending on the wavelength of lights like a prism. For our purpose we can use either a reflected light from the grating sheet or a transmitted light through the sheet, and we decided to use the transmitted light. A grating sheet is a sheet on which parallel lines are drawn with the distance (d) between the centers of adjacent lines. This distance is called as a lattice constant, and in our case the lattice constant is 2 micrometer. Instead of a grating sheet we can also use a CD where grooves are cut concentrically with the interval of 1.6 micrometer. As a CD is thick and a grating sheet is very thin, a CD is easier to work but it is not suitable for high precision spectroscope because of the finite curvature of the grooves and, of course, a label on the CD should be removed when transmitted lights are used.
Though the purpose of this kind of spectroscope is usually to measure the spectral distribution of an incident light, our purpose is to examine the performance of the camera attached to the back of the spectroscope for a known incident light. We, therefore, made the spectroscope so that the camera can be easily mounted and unmounted. As described later we used the spectral diagram in the visible range of the light of a fluorescent lamp to calibrate the wavelength on a taken photograph. For this reason, to examine an effect of a filter we place this filter in front of the spectroscope in order to avoid the movement during the mounting process of a filter to the camera. Moreover, as the purpose of this spectroscope is not to determine the spectral lines accurately but obtain a rough estimation of wavelength range to be photographed, we do not care that the resolution is very high.
The spectroscope is composed of a slit, a grating sheet and an adapter to set it to a camera. The structure is very simple to understand by looking at Figs.R4-1, R4-2. As a path of light we used a PVC pipe (42 mm and 45 mm outer diameter) for a rain gutter. These are just the right size to fit into each other. To observe the diffracted light of the first order we made an elbow-pipe by adhering two pipes cut obliquely.
Figure R4-3(a) shows a spectrum diagram of a fluorescent lamp (a 3-wavelength incandescent lamp type NEC fluorescent lamp: FCL40EX-L/38-X) measured by this simple spectroscope. For the sake of comparison a spectrum diagram obtained under the sunlight is shown in Fig.R4-3(b). Though there are several discrete peaks in the spectrum diagram of the fluorescent lamp the spectrum curve of the sunlight changes rather smoothly. To see this tendency more clearly we analyze the photograph by using the function "Plot Profile" of an image processing software “imageJ” developed by NIH and obtained a graph of intensity distribution along the horizontal axis ( the direction of the wavelength). The results obtained in this way is shown in Fig.R4-4.


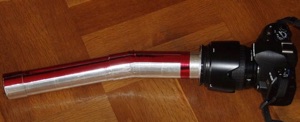
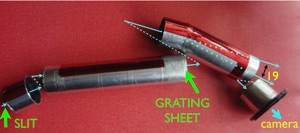


Figure R4-2 The simple spectroscope attached to an Olympus E-620. The spectroscope is fixed to the filter screw connection of a Zuiko Digital ED 18-180 F3.5-6.3 lens.


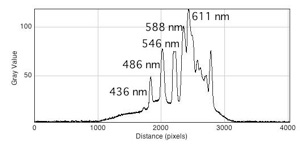
Figure R4-3 Spectra by the simple spectroscope. (a) spectrum of a fluorescent lamp, (b) spectrum of the solar light.
Figure R4-4 Intensity of the fluorescent lamp spectrum analyzed by using imageJ. Horizontal axis is the pixel number counted from the left end of the picture and the numbers denote the estimated wavelength of the peaks.
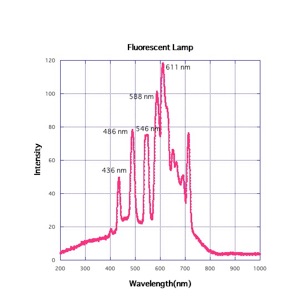
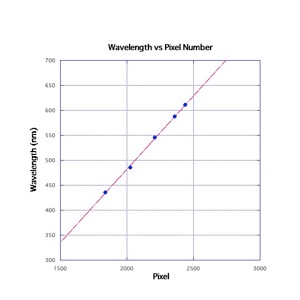
Figure R4-5: Relation of wavelength versus pixel number derived from the data of large peaks of the light of a fluorescent lamp. ● denotes the wavelengths of the large peaks.
Figure R4-6: Spectrum of a fluorescent lamp. It is the same graph as Fig.R4-4 except that the horizontal axis is changed to the wavelength from the pixel number by using the relation of Fig.R4-5.


Laboratory: Infrared Photography
Remark #4 Simple Spectroscope
(a)
(b)