Atelier Bonryu(E)

zone plate photography


Laboratory: Zone Plate Photography

Taking Zone Plate Photographs

- Remark -

Remark#5: Background Light

Background light and resolving power: First, let’s locate whereabout the incident light goes.  By normalizing the total amount of the incident light to unity the quantity of the light which converges to the main focal point (the 1st order focal point) is only
.  This is a sum of the light which comes directly through the central zone and the diffracted lights from the outer zones.  If the zone plate is replaced by a glass lens with the same diameter and the same focal length the quantity of the light converged to the main focal point is unity, and, therefore, in the case of a zone plate 90 % of the incident light disappears instead of converging at the main focus.  Moreover, the above discussion is for the case of a coherent light but  the natural light is not so ideal as being perfectly coherent.  Therefore, usually the ratio of light which converges at the main focal point by diffraction becomes considerably reduced.  In general the ratio of light converging at the m-th (or -m-th) order focal point is calculated as
, where the focal points with positive and negative order correspond to the focal points of convex and concave lenses, respectively.  The zeroth order diffracted light (a non-diffracted light) is a straightly going light which is considered to be a light converging at a point of the infinity.  Quantity of the non-diffracted light is 1/4, which is the largest value among quantities of lights converging at various focal points.  In reality as a half of the incident light is blocked at the opaque zones the remaining lights go through the transparent zones and most of them arrive at the image plane as background lights which make weak the contrast of the image.


By the way as the resolving power is not determined by a light intensity but by a light intensity per unit area, i. e., the illuminance, we consider here the intensity per unit area.  Geometrically the image of a point source is a mathematical point without an area but the image of a point source is a circle with a finite area because of the diffraction and, therefore, the light intensity per unit area can be calculated.  When the illuminance on the surface of the zone plate by a point source at infinity is e, the image of the point source becomes a circle with a radius of
at the focal plane and the illuminance at the focal point is
, where
and
are the wavelength of the light, the focal length, the radius of the outer boundary of the maximum zone and the number of the transparent zones, respectively.  In this way, the illuminance of the center of the image increases in proportion to
and the radius of the image of the point source decreases in inverse proportion to square root of the zone number
  with increasing the number of the transparent zones
.  This is the reason why the resolving power of a zone plate increases with increasing the number of zones.
 
Soft zone plate photographs: Then why zone plate photographs look so soft.  To answer the question we calculate the contrast of an image of a discoid light source at infinity.  Among various definitions of contrast we apply the definition of the Weber contrast C to the case of a zone plate imaging as
where
and
are the illuminance of the image of the object and the illuminance of the background light, respectively.  The illuminances of the image of the object and the background light are defined as


where
and
are the rates of the light going to the main focal point and the light proceeding forward,
is the total amount of the incident light, and
and
are the areas of the image and the background light.  The radius of the circular image of the object at infinity is assumed as p times as large as the radius of the image of a point source at infinity, which means the light source of the discoid image is a circular disk composed of
point sources at infinity.  In the second equation a factor q is multiplied to the incident light because a light which is not parallel to the focusing light also contributes as a background light.   Therefore, the areas of the image and the background light are
and
, and the total amount of the incident light is
.   From these equations the contrast of a zone plate photograph is derived as follows.


By using the relation
the following equation is derived.
        
 
Calculation of the contrast of a zone plate photograph: The contrast of a zone plate photograph is defined as a ratio of the illuminance of the image of the object to the illuminance of the background light for a circular image with a radius of
times that of a point source at infinity, where the light source is assumed as a discoid light source at infinity composed of q point sources.
 
When evaluating the contrast by using the above equation it should be remarked that there is a maximum
for the multiplication factor 
  of the area of the image, and for
larger than
the effect of the background lights does not increase.  The value of the maximum
is evaluated by using a condition 
as
   

This equation means that the contrast reaches the lower limit of about 1.4, when the size of image increases and becomes as large as the radius of the outermost zone.  Contrarily if the size of the image is as small as the resolution of the zone plate extremely high contrast is attained in proportion to the square of the number of zones.  However, it should be said over that the above evaluation is for the case of a perfectly coherent light and for an incoherent light the ratio of the light converging at the main focus decreases and the contrast becomes weak.


In this way the reason why a soft photograph with a high resolution can be taken by a zone plate is clarified.  The reason is because a high resolution photograph with a weak contrast due to the background light is taken by a zone plate.  It is especially important that the contrast of an image of a large photogenic object  becomes lower, which is clearly seen in photographs in Gallery of a zone plate of this web site.


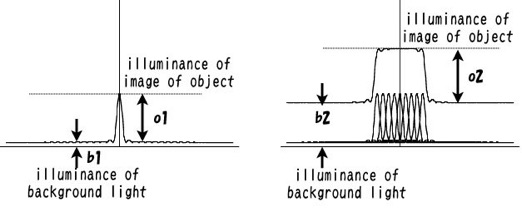
A schematic diagram explaining why a contrast of a large image is weak: The left figure shows illuminances of an image of a point source (o1) and associated background light (b1).  The right figure shows illuminances of an image of a point source (o2) and associated background light (b2) when the size of the image of the object is 9 times as large as that of the point source.  b2=9 x b1 but o2=o1.  Therefore, the Weber contrast C=o/b for the case of the right figure is smaller than that of the left figure by 1/9.

next=>ZP_Salon_R.6.html../atelier_bonryu/PH_Salon_1.2.htmlshapeimage_2_link_0
next=>ZP_Salon_R.6.html../atelier_bonryu/PH_Salon_1.2.htmlshapeimage_3_link_0

Home    Content    Gallery    Laboratory    About This Site    About Me    Link    Contact    Site History    Bonryu Club     Site Map