Atelier Bonryu(E)
infrared photography


Atelier Bonryu(E)
infrared photography


Laboratory: Infrared Photography
Taking an Infrared Photograph
2-5 Overall dependence on wavelength of a filter, a lens, and a sensor


When we take an infrared or an ultraviolet photograph, it is important how much do the sensitivity of sensors in digital cameras, the transmittance of the filter and the lens depend on the wavelength of the light. Among them the transmittance of the filter is usually made public by manufacturers but data of wavelength dependences of the sensor sensitivity and the transmittance of a lens are rarely published and it is difficult to know them.
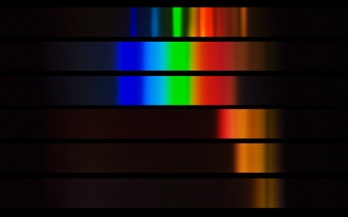
Measurement of Overall Dependence on Wavelength using Full Spectrum Converted Camera E-620: Spectral diagrams of the outdoor light are taken by using the full spectrum (converted) camera, Olympus E-620 with a Zuiko Digital lens, ED 18-180 F 3.5-6.3 for various filters (Fig.2-10). Filters used for this measurement are an IR-UV cut filter of Marumi, sheet filters, IR76, SC70, and SC66 of Fujifilm. The Marumi IR-UV cut filter is used for excluding the effects of an infrared or an ultraviolet light when we take a visible light photograph by using the full-spectrum converted camera E-620. As described in Remark #4 a fluorescent lamp of an incandescent-lamp-color 3-wavelength type (NEC: FCL40EX-L/38-X) was used for calibration of the axis of the wavelength. The following figure (Fig.2-10) is the spectra taken by the E-620 by using the above-described filters.
(a)
(b)
(c)
(d)
(e)
(f)
Fig. 2-10: Spectrum diagram
(a) Spectrum of a fluorescent lamp for wavelength calibration. (b-f) Spectra of the sunlight obtained by using various filters. (b) no filter case, (c) Marumi IR-UV-cut filter, (d) SC66 filter, (e) SC70 filter, (f) IR76 filter.
Needless to say, there is no recognizable color associated with ultraviolet and infrared lights. However, a digital camera outputs a colored image synthesized from signals of R, G, and B channels. In the above figure the orange or brown part on the right side of the red spectrum represents the infrared light and the dark blue part on the left represents the ultraviolet light. These parts are not visible to our eyes if we look at the output of the spectroscope directly. From comparison of Fig.2-10(b) with Fig.12-10(c) it is clear that infrared light is blocked by the IR-UV-cut filter. The differences in the effect of SC66, SC70, IR76 filters are also clearly seen. Though we can understand the effects of a filter and a sensor intuitively we cannot read out the wavelength range where an image is recorded. Therefore, we analyzed the range by using an image processing software “imageJ”. Results of the analyses are shown in the following graphs (Figs. 2-11~2-13), where the horizontal axis is the wavelength in nanometer (nm) and the vertical axis represents the light intensity. However, it should be noted that the absolute value of the measured light intensity is unknown as the strength of light entering the spectrometer has not been measured. Therefore, the intensity is normalized to the maximum intensity for every measurement carried out for a fixed filter or normalized to the maximum intensity obtained in the case where no filter was used.
Fig. 2-11: Effect of the IR-UV-cut filter
The red line denotes the case without the IR-UV-cut filter and the blue line denotes the case with the filter. The effect of the IR-UV-cut filter cannot seen clearly for the ultraviolet light region but it is clearly seen for the infrared light with the wavelength of 700-800 nm and the light with the wavelength more than 700 nm decreases suddenly.
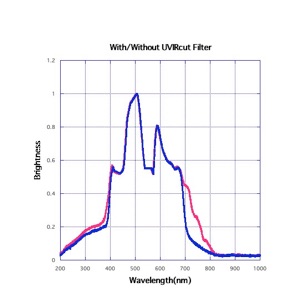
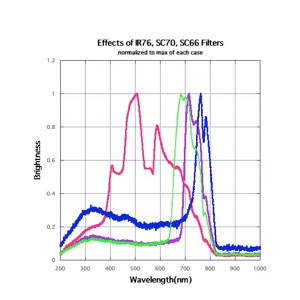
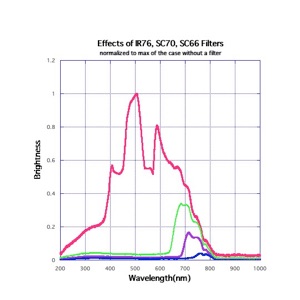
Fig.2-12: Effect of the IR-cut-Visible-Transparent filter
[red] without a filter, [green] a sharp cut filter SC66, [purple] a sharp cut filter SC70, [blue] an infrared filter IR76. Intensity is normalized to the maximum value of the case without a filter by taking the shutter speed into account.
Fig.2-13: Effect of the IR-cut -Visible -Transparent filter
This is a graph using the same data as Fig.2-12 but intensity values are normalized to the maximum value within each case of a filter. In an actual situation of photographing we are interested in change of light intensity with the change of wavelength for the mounted filter. Therefore, this figure may be more suitable than Fig.2-12 to understand the change of color due to change of a filter.
It becomes apparent on a first viewing of Fig.2-12 or Fig.2-13 that the intensity decreases abruptly at the wavelength of about 830 nm and a light with a longer wavelength than this value is not observed. Though data on the wavelength dependence of the sensitivity of the sensor of the E-620 are not found, it is found that the sensitivity of sensors decreases slowly with the wavelength to zero up to the wavelength of about 1000 nm according to published data on other CCD and MOS sensors. Therefore, it is unexpected result that the sensitivity becomes almost zero at 830 nm. Moreover,it is not known why there is considerable intensity at the wavelength less than 400 nm.
The sensor of Olympus E-620 is a 12MPixel live-MOS sensor whose technical data I could not find as described previously. As far as I analogize the wavelength dependence on the basis of published data of other sensors, with decreasing wavelength from the infrared region light intensities of R, G, and B channels decrease in the similar tendencies but from about 700 nm intensities of the three channels change considerably differently each other. For this reason a false color infrared photograph varies by changing the filters. It becomes colorful from a monotonous photograph by changing the filter from IR76 to SC70 and SC66. For reference sake published data of sensors on wavelength dependence are shown in Fig.2-14 and Fig.2-15 for 10MPixel live-MOS and a MOS sensor of Kodak, KAC-00401. The former is considered essentially the same sensor of the one used for E-620 and the data contain the effect of an IR-cut filter. The latter is different from the sensor of E-620 and it does not contain the effect of the IR-cut filter.
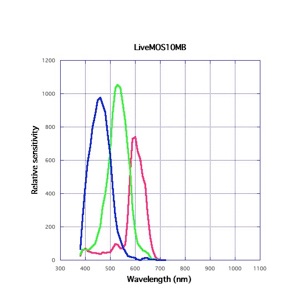
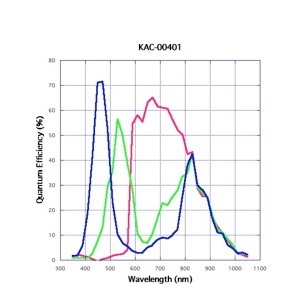
Fig.2-14: Wavelength dependence of a 10MPixel live-MOS sensor
Overall performance of a combination of an infrared cut filter, Bayer filter, and a bare sensor.
Fig2-15: Wavelength dependence of the sensitivity of a KAC-00401 sensor
Infrared cut filter is not included. With decreasing wavelength from the infrared region, the difference between the sensitivity of each channel becomes larger.


Wavelength Dependence of Photographic Components: By the way, what we are most interested in is the overall dependence on wavelength of the photographic components as a filter, a lens, and a sensor. This dependence can be measured by taking a photograph of a spectrum of a light with wide range of wavelength by using the intended filter, lens and sensor. So, we tried to examine a range of wavelengths of light that is observed for the combination of a variety of filters, lenses, and sensors by using a simple spectroscope made of a grating sheet. Details of the simple spectroscope used for the measurement are given in Remark #4. Though it seems that the following graphs give quantitative results, it should be noted that the results give only rough estimation of the wavelength range of lights to be recorded because these results have not been obtained under strictly controlled conditions. Since the results are obtained from outdoor measurements on a sunny day, the spectral distribution of the light can be conjectured roughly from the spectral distribution of the sunlight. But it is, of course, necessary to measure the spectrum of the incident light accurately for the quantitative discussion. Moreover, it should also be considered that the data obtained include effects introduced during the process by an electronic circuit of the camera.